On the Polygon Front Lines: Visualizing the Amplituhedron with the Wolfram Language
It’s rare to hear polygons mentioned in a physics class, even in higher education. This may seem unexpected given the fundamental role they play in mathematics. However, over the last few years, polygons have come to the front line in many areas of theoretical physics, helping us understand the laws of nature with their astonishing beauty.
This is particularly true in the field of particle physics, where a new geometrical object has been found to be connected to particle dynamics: the amplituhedron. It represents a novelty not only in physics but also in mathematics, generalizing the concept of a convex polygon. In this blog post, I will first discuss its relation to particle physics, and then how to visualize its geometry using the Wolfram Language.

A Little about Me
I’m a PhD student in theoretical physics at Durham University, United Kingdom. I was born in Venice, Italy, and I did my bachelor’s and master’s degrees in physics in the city of Trieste. After earning my degree, I was lucky enough to get into a wonderful PhD program (ITN) called SAGEX, which is funded by the European Union. We are a group of 15 early-stage researchers and as many supervisors distributed among 8 different academic institutions around Europe. The purposes of the project are to investigate the geometric structure hidden in the laws of particle dynamics and spread the word about all the amazing new discoveries in the field, like the amplituhedron.
As part of my SAGEX training, I’m spending three months as a visiting scholar at Wolfram Research in Champaign, Illinois. During my time here, I’ve started discovering all the features that the Wolfram Language offers to deal with many different geometries and represent them graphically. I spent a year or so working on the amplituhedron, and had a lot of fun creating a series of sketched drawings while trying to get some intuition about this funny object. Now that my experience at Wolfram is coming to an end, I think the time has come to transform those wrinkled leaves into some incredible, colorful pictures using the Wolfram Language.
Scattering Amplitudes
Our knowledge of elementary particles and their nature is almost entirely based on scattering experiments. Every day, in many laboratories around the world, particles such as electrons and protons are accelerated to extremely high velocity and crashed into one another. After the collision, the kinetic energy of crashing particles is converted into new particles. These new particles will then scatter in all directions, eventually hitting a detector where their velocity, charge and mass are recorded.
So, here’s the big question theoretical physicists are trying to answer: If I shoot two protons into one another, which type of particles might appear? In which direction and with what velocity? Physics is about making predictions. Trying to answer these types of questions corresponds to investigating the fundamental nature of particle interaction.

It just so happens that being able to give exact answers to this question is almost impossible. However, we can formulate approximate solutions with astonishing precision. The theory behind this representation of particle dynamics is called perturbative quantum field theory (QFT), and it was mainly the result of the work of S. Tomonaga, J. Schwinger and R. Feynman, who together won the Nobel Prize in Physics in 1965. Many mathematical steps are needed to carry out these calculations and then compare them with the data coming from the collision experiments.
At the core of this sophisticated procedure, there is a graph theory/combinatorial problem that is usually indicated as “the sum over all possible Feynman diagrams.” The result of this calculation is called a scattering amplitude, or sometimes just amplitude. Most of the time this step represents a bottleneck for the whole calculation. This is because its complexity grows factorially with the number of particles involved in the scattering and the precision we want to obtain. Increasing these two parameters quickly makes the computation impossible even for supercomputers.
From Geometry to Amplitudes
In the last 20 years, an enormous amount of progress has been made on the study of amplitudes. It’s a story in which the main character is the gluon, the mediator of the nuclear force. Here, I would like to highlight two remarkable discoveries, both from 2009, that are directly responsible for the discovery of the amplituhedron. The first is that a particular class of gluon amplitude can be thought of as a volume of a polytope. The second one is that all amplitudes in a particular theory, called planar N = 4 SYM, are strictly connected to the Grassmannian, which is a space of hyperplanes. In December 2013, N. Arkani-Hamed and J. Trnka published “The Amplituhedron” and were able to make a connection between these two amazing facts, opening new perspectives and puzzles. You can read more about this in J. Bourjaily and H. Thomas’s article, “What Is the Amplituhedron?”.
The amplituhedron is a very general geometric object that can appear in many forms. There are three important parameters that define the amplituhedron, usually denoted  ,
,  and
and  . is the dimension in which the amplituhedron lives. is the number of points that we use to build it. This parameter physically corresponds to the number of particles participating in the scattering process. The last one, , is more subtle both geometrically and physically. For
  , the amplituhedron is a four-dimensional polytope, the generalization of a two-dimensional polygon or three-dimensional polyhedron to higher dimensions.
A polygon can be thought of as the set of points trapped inside a curve given by many segments. As I will try to show you, the amplituhedron for  generalizes this idea to hyperplanes. For example, for
  , the amplituhedron will be given by a set of lines trapped inside an edge curve. Physically, the parameter roughly indicates the type of particles scattering.
The main goal of this blog post is to focus on the  case and use the Wolfram Language to create a visual representation of this weird set of lines, and also to show in which sense it represents the natural generalization of a polygon.
The amplituhedron has a stunning compact definition that can be given in one line, but to understand it we need to be able to read the language of projective geometry.
A Taste of Projective Geometry
Projective geometry is an incredibly powerful tool to map complex geometric problems to elementary linear algebra problems. The basic idea is that I can represent points in a plane as lines passing though the origin in three dimensions:

As you can see in the image, this correspondence can be built by fixing a plane and considering the intersection between the plane and the homogenous lines. In general, two points are needed to identify a line but, since each line is passing though the origin, one point is enough to determine it. In this image, the points are labeled by the  . You will notice that, if I multiply the coordinates of one of the ’s by a constant, the effect will be to move it along the line it represents. So for example, both
  and
and  will be equivalent because they represent the same line. This is in fact the formal way in which the projective space is defined. The two-dimensional projective space
  —that is, the one represented in the picture—is defined as the set of points
  in three dimensions identified by the equivalence relation
  .
.
OK, now that we have this fancy way to think about points, what we can do with it? First of all, notice that depending on which plane we project, the distances between points can change. The idea is that we would like to just work with lines in three dimensions, not dependent on the plane we are projecting on.
Determinants Are All You Need
What are the kinds of questions we can ask that do not depend on the specific projective plane we choose? There is a question that is particularly easy to answer in this setup: are three points aligned? In fact, if three points are aligned, the three vectors representing them will all be contained in a plane. This means that they will be linearly dependent, and therefore the determinant  will be 0.

What if the determinant is different from 0? Since the  are projective, we can’t say much. In fact, sending
  to
to  changes the sign of the determinant from positive to negative. One can decide, therefore, to be more restrictive and consider half-lines instead of lines. This amounts to restricting the equivalence relation
  to have
  . In this way, the sign of the determinant becomes invariant under the rescaling and becomes something we can meaningfully talk about.

There is a simple trick in three dimensions to understand if a determinant is positive or negative: the right-hand rule. Using this rule, you can easily see that the determinant  will be negative while the determinant
  will be positive. You can see this for yourself by playing with it, saying that point
  is on the right side of the line
  , which is the same as saying that
  . Beware, though! The notion of right and left changes if you are watching the projective plane from below or from above, in the same way that your right hand corresponds to the left hand of your mirror image.
Inside a Triangle
We will start by exploring the first way in which the amplituhedron can appear: the convex polygon. It’s in this projective formulation that A. Hodges in 2009 recognized that a particular gluon scattering amplitude was indeed the volume of a polytope in  . Unfortunately, we cannot see in four dimensions, so we will stick to
  without actually losing much of the general picture. Let’s start from the simplest polygon, the triangle.
Suppose I give you three vertices  , and I ask you to parametrize the space of all points inside the triangle. It seems like a simple yet very annoying task, doesn’t it? But there is an incredibly efficient way to do it!
Using physics to get some intuition, we can consider that each of these objects has a mass, and we want to calculate their common center of mass. The center of mass will correspond to the weighted average:
 Engage with the code in this post by downloading the Wolfram Notebook
|
✕
A = (\!\(\*SubscriptBox[\(m\),\(1\)]\)\!\(\*SubscriptBox[\(P\),\(1\)]\)+\!\(\*SubscriptBox[\(m\),\(2\)]\)\!\(\*SubscriptBox[\(P\),\(2\)]\)+\!\(\*SubscriptBox[\(m\),\(3\)]\)\!\(\*SubscriptBox[\(P\),\(3\)]\))/(\!\(\*SubscriptBox[\(m\),\(1\)]\)+\!\(\*SubscriptBox[\(m\),\(2\)]\)+\!\(\*SubscriptBox[\(m\),\(3\)]\)); |
… where the mass parameters  are clearly positive. The idea is that the center of mass will always lie somewhere among the three points depending on the values of the individual masses. We could be satisfied with this result, but we can actually do better. Let’s look at our triangle projectively. This time we will try to perform some visualization, so let’s choose some coordinates for the points
  :
:
|
✕
P = 2 Table[RandomReal[], 3, 2]; |
You can confirm that the type of logic we have used in two dimensions is also valid for points in three dimensions. We can construct these three-dimensional points out of the two-dimensional ones just by adding a new unit coordinate to all our points. We will call the new three-dimensional points newP.

Consider now the point  , which can be written in the Wolfram Language as:
|
✕
M = {\!\(\*SubscriptBox[\(m\),\(1\)]\),\!\(\*SubscriptBox[\(m\),\(2\)]\),\!\(\*SubscriptBox[\(m\),\(3\)]\)}
A = M.newP
|
The point  is not exactly on the triangle defined by the points
  , because of the
  factor. But here comes the change of perspective. Let’s think of all our points as half-lines (or oriented lines) passing though the origin:

If we rescale our points by a factor  , they will always represent the same line. This means that we can rescale
  so that it lies on the triangle—or even better, just invoke the equivalence relation
  .
.
We can summarize by saying that the inside of a triangle with vertices  ∈
∈  can be parametrized with the map .
Inside a Polygon
The beauty of this projective construction of the inside of a triangle is that it’s generalized in a straightforward way to polygons. Suppose this time instead of three points, we have five points  ∈
∈  . Following the center of mass argument and knowing that
  can be rescaled, we can immediately say that the inside of five points will be given by:
|
✕
A=\!\(\*SubscriptBox[\(m\),\(1\)]\)\!\(\*SubscriptBox[\(P\),\(1\)]\)+\!\(\*SubscriptBox[\(m\),\(2\)]\)\!\(\*SubscriptBox[\(P\),\(2\)]\)+\!\(\*SubscriptBox[\(m\),\(3\)]\)\!\(\*SubscriptBox[\(P\),\(3\)]\)+\!\(\*SubscriptBox[\(m\),\(4\)]\)\!\(\*SubscriptBox[\(P\),\(4\)]\)+\!\(\*SubscriptBox[\(m\),\(5\)]\)\!\(\*SubscriptBox[\(P\),\(5\)]\) |
Great, but this time there is a new element coming into play. Points can be arranged in different ways!


You can see that five points define a pentagon only if they are distributed in a specific way. So how can I be sure that the points I have chosen form a convex polygon? You can see that in the case of a convex polygon, if I take a line along one of the edges, like the line , all the other points will be on the same side of the line. This is not true for the line  in the first image. But we know how to express this concept mathematically: the concept of “being on the right side of a line” using the determinant! So, if we have n ordered points and we want to use them to represent a convex polygon like the one in the image, we must impose that
  for all
  If one considers the matrix
  , where is the number of points and is the dimension of the embedding space, the convexity condition is equivalent to saying that all the ordered minors of the
  maxtrix must be positive:

In this description of the inside of a polygon, you can see that there is a pairing of two positive spaces: the space of the mass-parameters vector  , where
  ; and the convexity of the space of points, where Minors
 and
and  stands for the dimension of the embedding space where our point
  lives. In the case of polygons,
  . In the next section, we will finally see the true novelty introduced by the amplituhedron in geometry: the Grassmannian polytope.
Inside an Amplituhedron
I previously pointed out that a polygon can be described as the set of points that are on the right side of a bunch of lines. What if instead of points, we would like to describe a space made of lines? Can we come up with some similar concept? The amplituhedron is exactly the answer to this question and generalizes this idea not only to lines but also to any hyperplane in any dimension. We will focus now on the space of lines in  , known as the Grassmannian
  , and here we will build the
  amplituhedron.
First, how can we mathematically describe a line in projective space? Well, one line is identified by two points. So instead of having just  , I can think of it as having two points,
  and
and  . If I just rewrite the definition of a polytope and promote the parameters vector
  to a
to a  matrix, I get:
|
✕
({
   {A},
   {B}
  }) = M.P
|
Now I have to find the inequalities defining the amplituhedron. If I see as a  matrix, I can rephrase the polygon positivity constraint by saying that all the ordered minors of
  are positive. You can see now that this definition naturally generalizes to matrices! Using this definition, the amplituhedron will be given by the pair of points
  parametrized by the formula
  , where all the ordered minors of both and
  are positive.
What does this space of lines look like? There are various ways to represent this space, as you will see. First of all, we have to fix some coordinates. It’s true that two points identify a line, but this is a redundant description. In fact, I can slide the points along the line, and they will keep describing the same line. In the embedding space, the points  and
and  are two vectors that span a plane. In other words, if
  is a
is a  matrix with
 and
and  will identify the same line in the projective space. The determinant is fixed to be positive to preserve the orientation of the line:

Let’s look now to the specific case in which I have four points  defining our amplituhedron in
  , meaning that the embedding space is four dimensional. First, I need the minors of
  to be positive. I can easily achieve this by choosing
  to be equal to the identity matrix. Then I have to take care of the positivity of the matrix
  . I can use the equivalence relation
 to reduce the number of parameters to four, and write the
  matrix as:
|
✕
M = ({
   {1, a, 0, -b},
   {0, c, 1, d}
  })
|
I choose this strange parametrization because its minors are particularly simple. In fact, if I calculate the minors and impose the positivity constraint, I get:
|
✕
ineq = # > 0 & /@ Flatten[Minors[M, 2]] |
Then, using Reduce to solve the inequalities, I obtain:
|
✕
Reduce[ineq] |
It’s a set of four inequalities as simple as it can be. To visualize this space of lines, first I have to project everything down to three dimensions. Any choice of the projective plane is valid. Here, I choose a plane orthogonal to the vector  . I then sample the parameter space, generating two thousand lines. I also add in the same plot of the tetrahedron formed by the points
  , and we get the result:

You can see that the amplituhedron in this case corresponds to lines passing inside a tetrahedron—or a bundle of wheat, if you like. You will also notice that two faces of the tetrahedron are crossed by the lines, while the other two are not. This image is suggestive but can also be misleading. In fact, there are lines that intersect the  and the
  faces of the amplituhedron that do not belong to the amplituhedron. To get the correct intuition, we have to look at the allowed regions for
  . You can see that
  is given by the product
  , which is exactly the definition we gave for the triangle. Therefore,
  belongs to the
  face of the tetrahedron, which corresponds to the red triangle in the following image. The point
  instead is defined as
  , which looks like a triangle but with a negative parameter. Again using the analogy with the center of mass, you can think of
  as having negative mass. Instead of dragging the center of mass toward its position, the negative term repels it toward infinity. I have represented its domain with the blue region at the bottom of the tetrahedron. One can prove that a line crossing the blue and red triangles will automatically also cross the green and yellow triangles. In fact, for different parametrizations of
  , we would have had
  belonging to the green triangle and
  to the yellow one.

Based on this image, we can say that the amplituhedron is the set of oriented lines intersecting the blue, green and yellow regions in this order, or any other cyclic variant of it. For example, another allowed sequence would be green, red, yellow, blue.
Last but not least, there’s still another very effective way to represent the amplituhedron. When I imagine a polygon, I usually think of its edges, and for a polyhedron I think of its faces. With respect to the description given previously, focused on the interior, this image corresponds to boundary representations. The boundaries of the space of lines defining the amplituhedron correspond to the boundary of the parameter space—that is, when one of the inequalities  gets saturated. For example, you can see that if I take the limit
  , the point
  will be equal to
  . This means that the segment
  is a boundary that the line
  cannot cross. By representing all boundary components, I can obtain an elegant and essential visualization. When I plot the boundaries with their orientations and one element of the amplituhedron, this is the result:

This image represents the amplituhedron as the set of all oriented lines trapped inside a red polygonal spiral. One thing that can be deceptive in this representation is that it seems that the gray line can be parallel to . This is actually false. What we mean by that is actually that both lines have the same direction. But this implies that they belong to the same plane, and therefore  will be equal to 0.
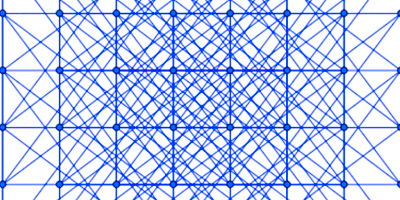
Finally, I would like to show you what an n-point  amplituhedron looks like in three dimensions. This time, I have to be sure that all the
  matrix minors are positive. In order to do this, I choose to distribute the points along a spiral. Distances in this business have no meaning, so I can choose to distribute the points in any way I like as long they satisfy the convexity requirement. I tried to distribute them in the nicest way, obtaining the polyhedron you see here:

As a final step, I can highlight the boundary of the amplituhedron. The  -point amplituhedron’s boundary is given by the union of the segments
  . There is a boundary term that is special, the segment
  . This segment, as we have seen for the four-point case, doesn’t go along the edge of the tetrahedron but goes along the complementary of the segment
  . The result:

I have smoothed down the polygonal spiral to give the illusion of an arbitrary number of points. In an analogy to the tetrahedron, we can say that the  -point amplituhedron in this example is given by all the oriented lines trapped inside the spiral.
The Importance of a Picture
In this blog post, I focused on one particular type of amplituhedron that lives in  , the space of lines in three projective dimensions. I have chosen this example because it’s the only amplituhedron with a physical interpretation that lives in fewer than four dimensions. One thing I really like about these spaces of lines or planes is that they are constructed using very primitive ideas. They force you to think about basic questions such as: What is a triangle? How do I usually picture it in my mind? I think these Grassmannian geometries really deserve a graphical representation capable of exposing their beauty and simplicity. It has been fun trying to achieve this for the
  amplituhedron, and I hope that you had fun too!
Bonus: Training for the Marathon
For those of you who were so determined to get to the bottom of this post, there are a lot other interesting ideas related to the amplituhedron that I encourage you to check out. You can see this blog post as training for this amazing marathon of lectures (you will see why it’s called a marathon) held by Nima Arkani-Hamed in June 2018 at the Center for Quantum Mathematics and Physics (QMAP) at UC Davis. In particular, the second lecture is a practical introduction to projective geometry, while the third one introduces the concept of the canonical form—the most notably absent topic in this post. The canonical form is in fact the map that connects the amplituhedron with actual amplitudes. Like the amplituhedron itself, it represents a novelty in mathematics and is a fascinating topic in its own right. Enjoy the run!

This project has received funding from the European Union’s Horizon 2020 research and innovation program under the Marie Skłodowska-Curie grant agreement no. 764850.
| Get full access to the latest Wolfram Language functionality with a Mathematica 12 or Wolfram|One trial. |
Well done, Gabriele! Cheers from Parik back in Champaign.
I will not claim i understand the amplituhedron in all detail, but this blog gives some really good insight into the thing. Nice work.