Financial Strategies with Mathematica Workshop and Seminar in New York on September 15
Mathematica 8 added a slew of powerful finance functions to its already large list of capabilities when it was released last November. To help highlight some of these features as well as assist those who want to use them, Wolfram Research is presenting both a finance workshop and a free seminar at the Club Quarters, Wall Street hotel in New York City on September 15.
We will cover a variety of topics, including how to:
- Customize analysis by leveraging application-specific functions with a high-level programming language
- Automatically apply any of the known trading indicators
- Perform code optimization and parallel processing of Monte Carlo simulations
- Easily create reports, charts, and interactive GUIs for presentations
- Reduce development time by working entirely within one environment
To give you a feeling for the topics that that will be covered in the finance workshop, I’ve included a few examples below that are a small subsection of the new financial technology in Version 8.
One of the most significant innovations is the ability to estimate a wide range of financial options. In fact, there are almost 100 different types of financial derivatives. Derivatives have three sublists of transformation rules that allow you to specify the option in terms of its name and exercise type, basic parameters, and ambient time-specific parameters such as the current price, and finally an optional list that allows you to ask for additional properties like the Greeks. In the following example we can insert derivative valuations into one of Mathematica‘s visualization functions like ListPlot3D to obtain the return surface of a call spread between different strikes:


Another important aspect of financial calculations are the recently enhanced probability and statistical functions.There are now 126 different types of distributions, including many that are important to financial evaluation like the Copula and Lévy distributions. The Copula distribution became infamous in the financial crisis when it was discovered that the Copula was routinely miscalculated using the multinormal variant when the underlying mortgage distributions were anything but normal. Mathematica allows 11 variants of the Copula distribution that can be fitted to the actual data.


Mathematica can access reams of price data and fundamental economic properties using FinancialData. For instance, you can study the erratic behavior of the S&P 500 in the new millennium:
![]()

If you are also interested in trading using FinancialData, there are almost 100 trading indicators to choose from. These indicators can be shown either superimposed upon the trading chart or displayed beneath it.


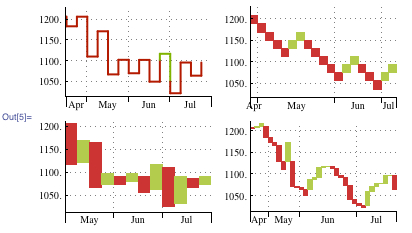
There are also many of the trend reversal charts that are a common technique to study price patterns


We also have parallelized option pricing using GPU technology, which is accessed by calling the CUDALink context:
![]()
We can now easily plot the return surface of an Asian arithmetic put spread between different strike prices. First we create the prices and expiration periods, and then include those prices and expirations as complete lists within CUDAFinancialDerivative:


Space is limited for the workshop and seminar, so register now.
All workshop attendees will receive a code for a 20% discount on a professional license of Mathematica at the conclusion of the event.
Visit the event web page for further details about time, location, schedule, and more.


+1