New in the Wolfram Language: TimelinePlot
A few years ago we created a timeline of the history of systematic data and computable knowledge, which you can look at online. I wrote the code that placed events along the timeline, and then our graphic designers did the real work in deciding where to put the labels, choosing fonts and colors, and doing all the other things that go into creating a production-quality poster.
Fast-forward a bit, and last year we added NumberLinePlot to the Wolfram Language to visualize points, intervals, and inequalities. Once people started seeing the number lines, we began getting requests for similar plots, but with dates and times, so we decided it was time to tackle TimelinePlot.
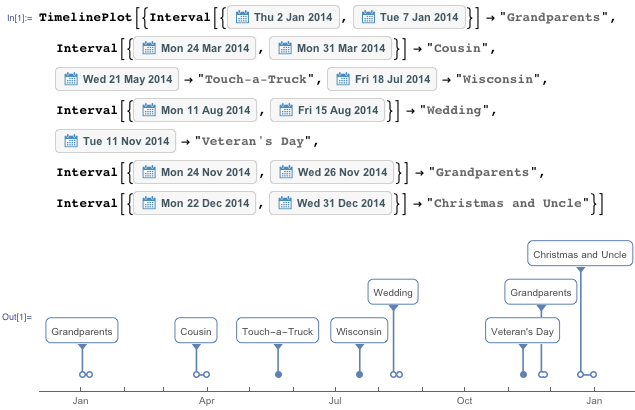
One difference between timelines and number lines, though, is the importance of labels and how commonly they’re used. We had to make it easy to include labels, and build a good system to automatically place them in a timeline. You can use rules to label dates, and the labels will be positioned so that they avoid overlapping as much as possible. The goal for labels was to automatically generate timelines that were of a similar quality to the ones our graphic designers had previously created by hand. Here’s an example of the vacations I took last year, with labels of where my family went, who we visited, or what we did:

It turns out that a lot of the entities that the Wolfram Language knows about have at least one date associated with them, so it’s easy to construct timelines from them. One of my favorite examples, which takes a little bit to set up, is a timeline showing when all the Star Trek movies were released:


In this case, labels are stacked very high so that the timeline fits in the width we have available. For such a narrow page, a vertical layout probably works better:

Or a horizontal layout that doesn’t stack the labels in neat columns:

In addition to creating cool posters and movie release timelines, TimelinePlot is also useful for tracking flight schedules, logging calendar entries, charting historical people and events, conference and other event planning, and more.
Version 10.1 of the Wolfram Language is now supported in Mathematica and rolling out in all other Wolfram products.
Download this post as a Computable Document Format (CDF) file.


Looks great but what a pity we have to wait for the next release… so 2016+?
It is wonderful. i’m very happy if I can plot TimeSeries data and put short movies with TimelinePlot.
I’d like to share a different visualization method for displaying many events over time:
https://districtdatalabs.silvrback.com/time-maps-visualizing-discrete-events-across-many-timescales
It would be a great companion to the timeline plot!