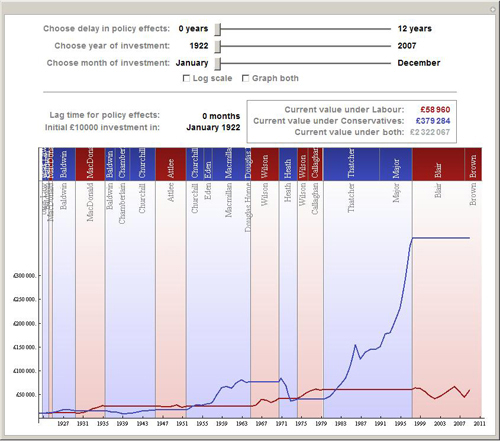
UK Investment Returns under Conservative and Labour Governments
As the closing days of the United Kingdom election campaign have focused on the economy, I thought I would repeat the analysis that Theodore Gray did on Dow Jones returns under United States presidential parties—but using UK data.
I started by going to an interactive Mathematica Demonstration that Theodore wrote. Like all Demonstrations, it doesn’t just present information, it encodes the analysis, so by downloading the source code, I was able to re-deploy it on UK data quite quickly. The data was a little more difficult (detailed at the end of this post).
So what did I find?
Well at first glance, it is a strong win for the Conservative party. If you started with £10,000 just after the last Liberal government in the 1920s and only invested in Conservative government years, you would end with £397,000, compared to £59,000 if you invested only in Labour years.

Unlike in the US case, modest assumptions about the lag time before policies take effect do not fundamentally change the conclusion. If anything they make the difference greater by putting the blame for the problems in the early 1970s onto Labour’s Harold Wilson.

You need to assume a lag of nine years before Labour edges ahead in returns.

In the UK case, though, it is not a steady story. Little of the returns are in the early years while the UK struggled with post-war reconstruction of its economy, right through to the 1970s’ times of inflation and industrial action. The big returns start in the 1980s. So in the end, this is largely a comparison of returns during the Thatcher/Major Conservative governments against the Blair/Brown Labour governments.
And just as in Theodore’s analysis of US markets, the best return has been to invest steadily regardless of who is in charge.
Notes on the data used:
Unfortunately, the FTSE 100, the UK equivalent of the Dow Jones index, only goes back as far as 1984, so the rest has been filled in from “‘Excess Volatility’ on the London Stock Market, 1870–1990” (De Long and Grossman, 1993). Having learned the lessons of Theodore’s analysis, I have only looked at real returns (taking into account inflation), including dividend payments. This is particularly important for the older data, when dividends were pretty much the whole reason for owning shares and source of all the returns.
The remaining problem was that I only had annual data, so rather than rewrite Theodore’s code I took the approximating step of generating monthly data by assuming steady returns throughout the year. This means that very sharp shocks to the markets have been smoothed over the year. This should not be important unless the shock happened around the end of a government (allowing for the delay that you have chosen).


I am no extreme lover of Cameron – he’s just fine – but at any rate, time for the Britons to buy their stocks. ;-)
Thank you for going to the trouble to prove what I always suspected.
The FTSE100 is not the equivalent of the Dow Jones. The FT30 is the equivalent, and data for that index goes back on a daily basis for a long time – certainly enough for this study.
Unfortunately, both the FT30 and the Dow are regarded as unrepresentative. Most people use the FTSE100 and the S&P500 for calculation purposes – obviously not possible.
The FT-Actuaries All-Share index which was introduced in 1962 is a better measuring gauge than the FTSE 100. Previous to that the FT30 is a guide to the direction of the market but as it uses the geometrical mean rather than the arithmetical mean it understates the extent of the rise or fall in the market.
If you want some useful data consult “Triumph of the Optimists” by Dimson, Marsh and Staunton which supplies not only nominal but also real returns on investment for the whole of the twentieth century.
I like this very much
How do I combine two instruments at the same time. such as drums and metronome. Thank you … If you allow, I request the source code for wolframtone. I try to create an orchestra but I can not combine two or more musical instruments. How solution??
Thanks for sharing such a great idea and a wonderful website! I am looking forward to more great posts from you.