New in 14: Astronomy
Two years ago we released Version 13.0 of Wolfram Language. Here are the updates in astronomy since then, including the latest features in 14.0. The contents of this post are compiled from Stephen Wolfram’s Release Announcements for 13.1, 13.2, 13.3 and 14.0.
Going Off Planet: The Astro Story 14 (January 2024)
A major new capability added since Version 13 is astro computation. It begins with being able to compute to high precision the positions of things like planets. Even knowing what one means by “position” is complicated, though—with lots of different coordinate systems to deal with. By default AstroPosition gives the position in the sky at the current time from your Here location:

But one can instead ask about a different coordinate system, like global galactic coordinates:

And now here’s a plot of the distance between Saturn and Jupiter over a 50-year period:

In direct analogy to GeoGraphics, we’ve added AstroGraphics, here showing a patch of sky around the current position of Saturn:

And this now shows the sequence of positions for Saturn over the course of a couple of years—yes, including retrograde motion:

There are many styling options for AstroGraphics. Here we’re adding a background of the “galactic sky”:

And here we’re including renderings for constellations (and, yes, we had an artist draw them):

Something specifically new in Version 14.0 has to do with extended handling of solar eclipses. We always try to deliver new functionality as fast as we can. But in this case there was a very specific deadline: the total solar eclipse visible from the US on April 8, 2024. We’ve had the ability to do global computations about solar eclipses for some time (actually since soon before the 2017 eclipse). But now we can also do detailed local computations right in the Wolfram Language.
So, for example, here’s a somewhat detailed overall map of the April 8, 2024, eclipse:

Now here’s a plot of the magnitude of the eclipse over a few hours, complete with a little “rampart” associated with the period of totality:

And here’s a map of the region of totality every minute just after the moment of maximum eclipse:

Introducing Astro Computation (December 2022)
Astronomy has been a driving force for computation for more than 2000 years (from the Antikythera device on)… and in Version 13.2 it’s coming to Wolfram Language in a big way. Yes, the Wolfram Language (and Wolfram|Alpha) have had astronomical data for well over a decade. But what’s new now is astronomical computation fully integrated into the system. In many ways, our astro computation capabilities are modeled on our geo computation ones. But astro is substantially more complicated. Mountains don’t move (at least perceptibly), but planets certainly do. Relativity also isn’t important in geography, but it is in astronomy. And on the Earth, latitude and longitude are good standard ways to describe where things are. But in astronomy—especially with everything moving—describing where things are is much more complicated. Oh, and there’s the question of where things “are,” versus where things appear to be—because of effects ranging from light-propagation delays to refraction in the Earth’s atmosphere.
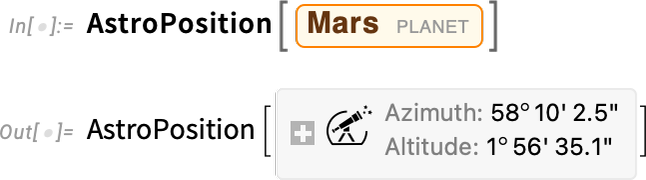
The key function for representing where astronomical things are is AstroPosition. Here’s where Mars is now:
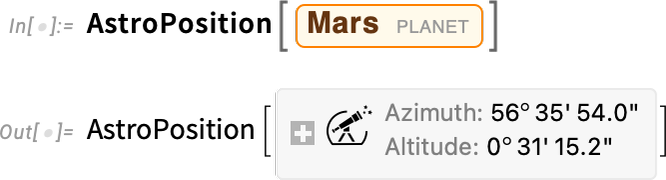
What does that output mean? It’s very “here and now” oriented. By default, it’s telling me the azimuth (angle from north) and altitude (angle above the horizon) for Mars from where Here says I am, at the time specified by Now. How can I get a less “personal” representation of “where Mars is”? Because if even I just reevaluate my previous input now, I’ll get a slightly different answer, just because of the rotation of the Earth:
One thing to do is to use equatorial coordinates, that are based on a frame centered at the center of the Earth but not rotating with the Earth. (One direction is defined by the rotation axis of the Earth, the other by where the Sun is at the time of the spring equinox.) The result is the “astronomer-friendly” right ascension/declination position of Mars:

And maybe that’s good enough for a terrestrial astronomer. But what if you want to specify the position of Mars in a way that doesn’t refer to the Earth? Then you can use the now-standard ICRS frame, which is centered at the center of mass of the Solar System:

Often in astronomy the question is basically “which direction should I point my telescope in?”, and that’s something one wants to specify in spherical coordinates. But particularly if one’s “out and about in the Solar System” (say thinking about a spacecraft), it’s more useful to be able to give actual Cartesian coordinates for where one is:

And here are the raw coordinates (by default in astronomical units):
AstroPosition is backed by lots of computation, and in particular by ephemeris data that covers all planets and their moons, together with other substantial bodies in the Solar System:

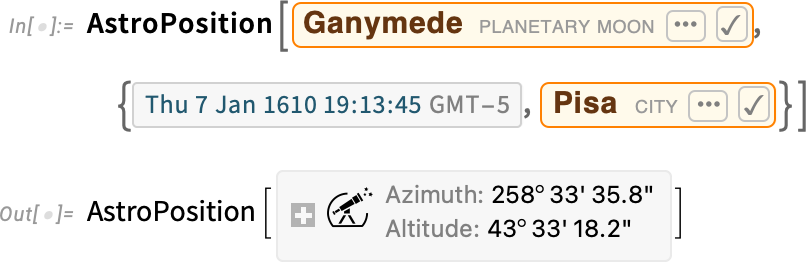
By the way, particularly the first time you ask for the position of an obscure object, there may be some delay while the necessary ephemeris gets downloaded. The main ephemerides we use give data for the period 2000–2050. But we also have access to other ephemerides that cover much longer periods. So, for example, we can tell where Ganymede was when Galileo first observed it:
We also have position data for more than 100,000 stars, galaxies, pulsars and other objects—with many more coming soon:
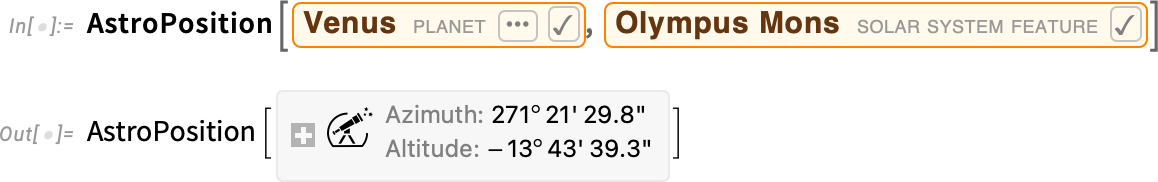
Things get complicated very quickly. Here’s the position of Venus seen from Mars, using a frame centered at the center of Mars:
If we pick a particular point on Mars, then we can get the result in azimuth-altitude coordinates relative to the Martian horizon:
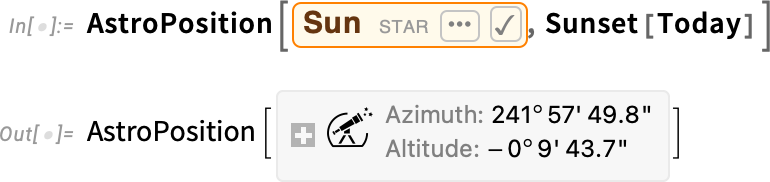
Another complication is that if you’re looking at something from the surface of the Earth, you’re looking through the atmosphere, and the atmosphere refracts light, making the position of the object look different. By default, AstroPosition takes account of this when you use coordinates based on the horizon. But you can switch it off, and then the results will be different—and, for example, for the Sun at sunset, substantially different:

And then there’s the speed of light, and relativity, to think about. Let’s say we want to know where Neptune “is” now. Well, do we mean where Neptune “actually is”, or do we mean “where we observe Neptune to be” based on light from Neptune coming to us? For frames referring to observations from Earth, we’re normally concerned with the case where we include the “light time” effect—and, yes, it does make a difference:

OK, so AstroPosition—which is the analog of GeoPosition—gives us a way to represent where things are, astronomically. The next important function to discuss is AstroDistance—the analog of GeoDistance.
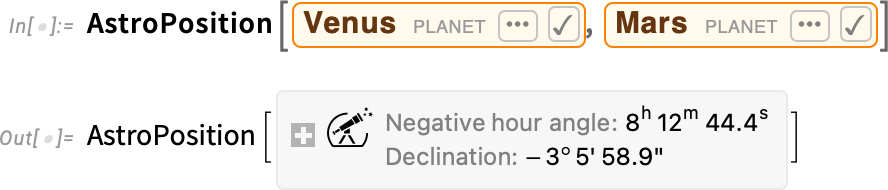
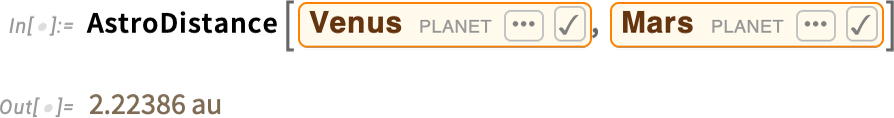
This gives the current distance between Venus and Mars:
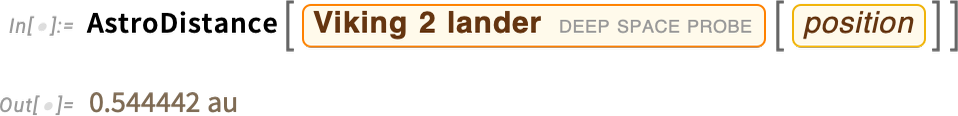
This is the current distance from where we are (according to Here) and the position of the Viking 2 lander on Mars:
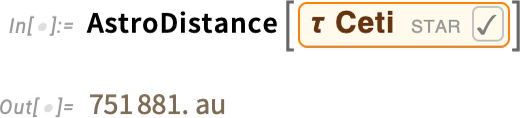
This is the distance from Here to the star τ Ceti:
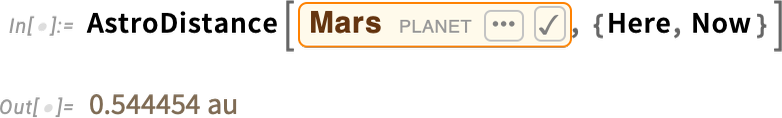
To be more precise, AstroDistance really tells us the distance from a certain object, to an observer, at a certain local time for the observer (and, yes, the fact that it’s local time matters because of light delays):
And, yes, things are quite precise. Here’s the distance to the Apollo 11 landing site on the Moon, computed 5 times with a 1-second pause in between, and shown to 10-digit precision:

This plots the distance to Mars for every day in the next 10 years:

Another function is AstroAngularSeparation, which gives the angular separation between two objects as seen from a given position. Here’s the result from Jupiter and Saturn (seen from the Earth) over a 20-year span:

The Beginnings of Astro Graphics (December 2022)
In addition to being able to compute astronomical things, Version 13.2 includes first steps in visualizing astronomical things. There’ll be more on this in subsequent versions. But Version 13.2 already has some powerful capabilities.
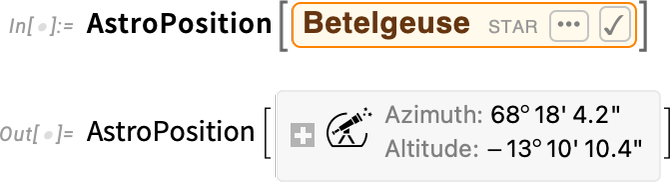
As a first example, here’s a part of the sky around Betelgeuse as seen right now from where I am:

Zooming out, one can see more of the sky:

There are lots of options for how things should be rendered. Here we’re seeing a realistic image of the sky, with grid lines superimposed, aligned with the equator of the Earth:

And here we’re seeing a more whimsical interpretation:

Just like for maps of the Earth, projections matter. Here’s a Lambert azimuthal projection of the whole sky:

The blue line shows the orientation of the Earth’s equator, the yellow line shows the plane of the ecliptic (which is basically the plane of the Solar System), and the red line shows the plane of our galaxy (which is where we see the Milky Way).
If we want to know what we actually “see in the sky” we need a stereographic projection (in this case centered on the south direction):

There’s a lot of detail in the astronomical data and computations we have (and even more will be coming soon). So, for example, if we zoom in on Jupiter we can see the positions of its moons (though their disks are too small to be rendered here):

It’s fun to see how this corresponds to Galileo’s original observation of these moons more than 400 years ago. This is from Galileo:


The old typesetting does cause a little trouble:

But the astronomical computation is more timeless. Here are the computed positions of the moons of Jupiter from when Galileo said he saw them, in Padua:

And, yes, the results agree!
By the way, here’s another computation that could be verified soon. This is the time of maximum eclipse for an upcoming solar eclipse:

And here’s what it will look like from a particular location right at that time: