New in 13.2: The Beginnings of Astro Graphics
Last year we released Version 13.1 of the Wolfram Language. Here are the updates in astro computation since then, including the latest features in 13.2.
The Beginnings of Astro Graphics
In addition to being able to compute astronomical things, Version 13.2 includes first steps in visualizing astronomical things. There’ll be more on this in subsequent versions. But Version 13.2 already has some powerful capabilities.
As a first example, here’s a part of the sky around Betelgeuse as seen right now from where I am:

Zooming out, one can see more of the sky:

There are lots of options for how things should be rendered. Here we’re seeing a realistic image of the sky, with grid lines superimposed, aligned with the equator of the Earth:

And here we’re seeing a more whimsical interpretation:

Just like for maps of the Earth, projections matter. Here’s a Lambert azimuthal projection of the whole sky:

The blue line shows the orientation of the Earth’s equator, the yellow line shows the plane of the ecliptic (which is basically the plane of the Solar System), and the red line shows the plane of our galaxy (which is where we see the Milky Way).
If we want to know what we actually “see in the sky” we need a stereographic projection (in this case centered on the south direction):

There’s a lot of detail in the astronomical data and computations we have (and even more will be coming soon). So, for example, if we zoom in on Jupiter we can see the positions of its moons (though their disks are too small to be rendered here):

It’s fun to see how this corresponds to Galileo’s original observation of these moons more than 400 years ago. This is from Galileo:


The old typesetting does cause a little trouble:

But the astronomical computation is more timeless. Here are the computed positions of the moons of Jupiter from when Galileo said he saw them, in Padua:

And, yes, the results agree!
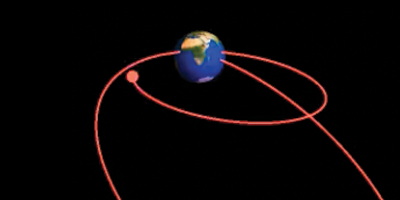
By the way, here’s another computation that could be verified soon. This is the time of maximum eclipse for an upcoming solar eclipse:

And here’s what it will look like from a particular location right at that time:


Comments