Analyzing Social Networks of Colonial Boston Revolutionaries with the Wolfram Language

As the Fourth of July approaches, many in America will celebrate 241 years since the founders of the United States of America signed the Declaration of Independence, their very own disruptive, revolutionary startup. Prior to independence, colonists would celebrate the birth of the king. However, after the Revolutionary War broke out in April of 1775, some colonists began holding mock funerals of King George III. Additionally, bonfires, celebratory cannon and musket fire and parades were common, along with public readings of the Declaration of Independence. There was also rum.
Today, we often celebrate with BBQ, fireworks and a host of other festivities. As an aspiring data nerd and a sociologist, I thought I would use the Wolfram Language to explore the Declaration of Independence using some basic natural language processing.
Using metadata, I’ll also explore a political network of colonists with particular attention paid to Paul Revere, using built-in Wolfram Language functions and network science to uncover some hidden truths about colonial Boston and its key players leading up to the signing of the Declaration of Independence.
The Declaration of Independence and the Wolfram Data Repository
The Wolfram Data Repository was recently announced and holds a growing collection of interesting resources for easily computable results.

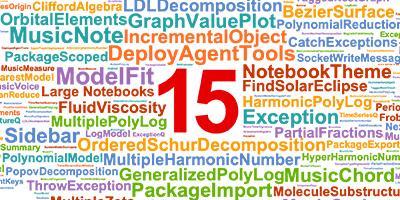
As it happens, the Wolfram Data Repository includes the full text of the Declaration of Independence. Let’s explore the document using WordCloud by first grabbing it from the Data Repository.
![]()
![WordCloud[DeleteStopwords@doi]](https://content.wolfram.com/sites/39/2017/06/InOutImg215.png "WordCloud[DeleteStopwords@doi]")
Interesting, but this isn’t very patriotic thematically, so let’s use ColorFunction and then use DeleteStopwords to remove the signers of the document.
![WordCloud[ DeleteStopwords@ StringDelete[ ToLowerCase[doi], {"john", "thomas", "george", "samuel", "francis", "lewis", "richard", "james", "morris", "benjamin", "adams", "william", "jr.", "lee", "abraham"}], FontFamily -> "Zapfino", ColorFunction -> "SolarColors"]](https://content.wolfram.com/sites/39/2017/06/InOutImg33.png "WordCloud[ DeleteStopwords@ StringDelete[ ToLowerCase[doi], {\"john\", \"thomas\", \"george\", \"samuel\", \"francis\", \"lewis\", \"richard\", \"james\", \"morris\", \"benjamin\", \"adams\", \"william\", \"jr.\", \"lee\", \"abraham\"}], FontFamily -> \"Zapfino\", ColorFunction -> \"SolarColors\"]")
As we can see, the Wolfram Language has deleted the names of the signers and made words larger as a function of their frequency in the Declaration of Independence. What stands out is that the words “laws” and “people” appear the most frequently. This is not terribly surprising, but let’s look at the historical use of those words using the built-in WordFrequencyData functionality and DateListPlot for visualization. Keeping with a patriotic theme, let’s also use PlotStyle to make the plot red and blue.
![DateListPlot[WordFrequencyData[{"laws", "people"}, "TimeSeries"], PlotStyle -> {Red, Blue}, FrameTicks -> {True, False}]](https://content.wolfram.com/sites/39/2017/06/InOutImg43.png "DateListPlot[WordFrequencyData[{\"laws\", \"people\"}, \"TimeSeries\"], PlotStyle -> {Red, Blue}, FrameTicks -> {True, False}]")
What is incredibly interesting is that we can see a usage spike around 1776 in both words. The divergence between the use of the two words over time also strikes me as interesting.
A Social Network of Colonial Boston
According to historical texts, colonial Boston was a fascinating place in the late 18th century. David Hackett Fischer’s monograph Paul Revere’s Ride paints a comprehensive picture of the political factions that were driving the revolutionary movement. Of particular interest are the Masonic lodges and caucus groups that were politically active and central to the Revolutionary War.
Those of us raised in the United States will likely remember Paul Revere from our very first American history classes. He famously rode a horse through what is now the greater Boston area warning the colonial militia of incoming British troops, known as his “midnight ride,” notably captured in a poem by Henry Wadsworth Longfellow in 1860.
Up until Fischer’s exploration of Paul Revere’s political associations and caucus memberships, historians argued the colonial rebel movement was controlled by high-ranking political elites led by Samuel Adams, with many concluding Revere was simply a messenger. That he was, but through that messaging and other activities, he was key to joining together political groups that otherwise may not have communicated, as I will show through network analysis.
As it happens, this time last year I was at the Wolfram Summer School, which is currently in progress at Bentley University. One of the highlights of my time there was a lecture on social network analysis, led by Charlie Brummitt, that used metadata to analyze colonial rebels in Boston.
Duke University sociologist Kieran Healy has a fantastic blog post exploring this titled “Using Metadata to Find Paul Revere” that the lecture was derived from. I’m going to recreate some of his analysis with the Wolfram Language and take things a bit further with more advanced visualizations.
“Remember the ladies”
First, however, as a sociologist, my studies and research are often concerned with inequalities, power and marginalized groups. I would be remiss if I did not think of Abigail Adams’s correspondence with her husband John Adams on March 31, 1776, in which she instructed him to “remember the ladies” at the proceedings of the Continental Congress. I made a WordCloud of the letter here.

The data we are using is exclusively about men and membership data from male-only social and political organizations. It is worth noting that during the Revolutionary period, and for quite a while following, women were legally barred from participating in most political affairs. Women could vote in some states, but between 1777 and 1787, those rights were stripped in all states except New Jersey. It wasn’t until August 18, 1920, that the 19th Amendment passed, securing women’s right to vote unequivocally.
To that end, under English common law, women were treated as femes covert, meaning married women’s rights were absorbed by their husbands. Not only were women not allowed to vote, coverture laws dictated that a husband and wife were one person, with the former having sole political decision-making authority, as well as the ability to buy and sell property and earn wages.
Following the American Revolution, the United States was free from the tyranny of King George III; however, women were still subservient to men legally and culturally. For example, Hannah Griffitts, a poet known for her work about the Daughters of Liberty, “The Female Patriots,” expressed in a 1785 diary entry sentiments common among many colonial women:
The glorious fourth—again appears
A Day of Days—and year of years,
The sum of sad disasters,
Where all the mighty gains we see
With all their Boasted liberty,
Is only Change of Masters.
There is little doubt that without the domestic and emotional labor of women, often invisible in history, these men, the so-called Founding Fathers, would have been less successful and expedient in achieving their goals of independence from Great Britain. So today, we remember the ladies, the marginalized and the disenfranchised.
Political Groups of Colonial Boston: Obtaining the Data and Exploratory Analysis
Conveniently, I uploaded a cleaned association matrix of political group membership in colonial Boston as a ResourceObject to the Data Repository. We’ll import with ResourceData to give us a nice data frame to work with.
![]()
![]()
![]()
We can see we have 254 colonists in our dataset. Let’s take a look at which colonial rebel groups Samuel Adams was a member of, as he’s known in contemporary times for a key ingredient in Fourth of July celebrations, beer.
![PaulRevereData@SelectFirst[#["Name"] == "Samuel Adams" &]](https://content.wolfram.com/sites/39/2017/06/InOutImg84.png "PaulRevereData@SelectFirst[#[\"Name\"] == \"Samuel Adams\" &]")
Our True/False values indicate membership in one of seven political organizations: St. Andrews Lodge, Loyal Nine, North Caucus, the Long Room Club, the Tea Party, the Boston Committee of Correspondence and the London Enemies.
We can see Adams was a member of four of these. Let’s take a look at Revere’s memberships.
![PaulRevereData@SelectFirst[#["Name"] == "Paul Revere" &]](https://content.wolfram.com/sites/39/2017/06/InOutImg94.png "PaulRevereData@SelectFirst[#[\"Name\"] == \"Paul Revere\" &]")
As we can see, Revere was slightly more involved, as he is a member of five groups. We can easily graph his membership in these political organizations. For those of you unfamiliar with how a network functions, nodes represent agents and the lines between them represent some sort of connection, interaction or association.
![lodges = Normal@Rest[Keys[First[PaulRevereData]]]; With[{g = Flatten[Normal[With[{row = #, name = #Name}, If[row[#], name <-> #, Nothing] & /@ lodges] & /@ PaulRevereData]]}, HighlightGraph[g, NeighborhoodGraph[g, "Paul Revere", 1, VertexLabels -> Automatic], GraphLayout -> "RadialDrawing", VertexLabels -> Automatic, VertexLabelStyle -> Background -> White, ImageSize -> Large]]](https://content.wolfram.com/sites/39/2017/06/InOutImg104.png "lodges = Normal@Rest[Keys[First[PaulRevereData]]]; With[{g = Flatten[Normal[With[{row = #, name = #Name}, If[row[#], name <-> #, Nothing] & /@ lodges] & /@ PaulRevereData]]}, HighlightGraph[g, NeighborhoodGraph[g, \"Paul Revere\", 1, VertexLabels -> Automatic], GraphLayout -> \"RadialDrawing\", VertexLabels -> Automatic, VertexLabelStyle -> Background -> White, ImageSize -> Large]]")
There are seven organizations in total, so let’s see how they are connected by highlighting political organizations as red nodes, with individuals attached to each node.
![HighlightGraph[Flatten[Normal[With[{row = #, name = #Name}, If[row[#], name <-> #, Nothing] & /@ lodges] & /@ PaulRevereData]], lodges, VertexLabels -> Placed["Name", Top], ImageSize -> Large, VertexLabelStyle -> Background -> White, VertexSize -> 3]](https://content.wolfram.com/sites/39/2017/06/InOutImg118.png "HighlightGraph[Flatten[Normal[With[{row = #, name = #Name}, If[row[#], name <-> #, Nothing] & /@ lodges] & /@ PaulRevereData]], lodges, VertexLabels -> Placed[\"Name\", Top], ImageSize -> Large, VertexLabelStyle -> Background -> White, VertexSize -> 3]")
We can see the Tea Party and St. Andrews Lodge have many more members than Loyal Nine and others, which we will now explore further at the micro level.
Network of Individuals in Political Organizations: Closeness and Centrality
What we’ve done so far is fairly macro and exploratory. Let’s drill down by looking at each individual’s connection to one another by way of shared membership in these various groups. Essentially, we are removing our political organization nodes and focusing on individual colonists. We’ll use Tooltip to help us identify each actor in the network.
![bipartiteAdjacencyMatrix = Boole@Normal[PaulRevereData[Values, Rest]]; edges = ReplacePart[ bipartiteAdjacencyMatrix.Transpose[bipartiteAdjacencyMatrix], {i_, i_} -> 0]; personPersonGraph = AdjacencyGraph[colonistsNames, edges, EdgeStyle -> {Opacity[.1]}, GraphLayout -> "RadialDrawing", ImageSize -> Large, VertexSize -> Automatic, VertexLabels -> Placed["Name", Tooltip], PlotLabel -> "Colonist Network"]](https://content.wolfram.com/sites/39/2017/06/InOutImg125.png "bipartiteAdjacencyMatrix = Boole@Normal[PaulRevereData[Values, Rest]]; edges = ReplacePart[ bipartiteAdjacencyMatrix.Transpose[bipartiteAdjacencyMatrix], {i_, i_} -> 0]; personPersonGraph = AdjacencyGraph[colonistsNames, edges, EdgeStyle -> {Opacity[.1]}, GraphLayout -> \"RadialDrawing\", ImageSize -> Large, VertexSize -> Automatic, VertexLabels -> Placed[\"Name\", Tooltip], PlotLabel -> \"Colonist Network\"]")
We now use a social network method called BetweennessCentrality that measures the centrality of an agent in a network. It is the fraction of shortest paths between pairs of other agents that pass through that agent. Since the actor can broker information between the other agents, for example, this measure becomes key in determining the importance of a particular node in the network by measuring how a node lies between pairs of actors with nothing lying between a node and other actors.
We’ll first create a function that will allow us to visualize not only BetweennessCentrality, but also EigenvectorCentrality and ClosenessCentrality.
![HighlightCentrality[g_, cc_] := HighlightGraph[g, Table[Style[VertexList[g][[i]], ColorData["TemperatureMap"][cc[[i]]/Max[cc]]], {i, VertexCount[g]}]]](https://content.wolfram.com/sites/39/2017/06/InOutImg134.png "HighlightCentrality[g_, cc_] := HighlightGraph[g, Table[Style[VertexList[g][[i]], ColorData[\"TemperatureMap\"][cc[[i]]/Max[cc]]], {i, VertexCount[g]}]]")
We begin with some brief code for BetweennessCentrality that uses the defined ColorData feature to show us which actors have the highest ability to transmit resources or information through the network, along with the Tooltip that was previously defined.
![HighlightCentrality[personPersonGraph, BetweennessCentrality[personPersonGraph]]](https://content.wolfram.com/sites/39/2017/06/InOutImg144.png "HighlightCentrality[personPersonGraph, BetweennessCentrality[personPersonGraph]]")
Lo and behold, Paul Revere appears to have a vastly higher betweenness score than anyone else in the network. Significantly, John Adams is at the center of our radial graph, but he does not appear to have much power in the network. Let’s grab the numbers.
![TopFive[measure_, heading_] := TableForm[ TakeLargestBy[Transpose[{colonistsNames, measure}], #[[2]] &, 5], TableHeadings -> {None, {"Colonist Rebel", heading}}]](https://content.wolfram.com/sites/39/2017/06/InOutImg154.png "TopFive[measure_, heading_] := TableForm[ TakeLargestBy[Transpose[{colonistsNames, measure}], #[[2]] &, 5], TableHeadings -> {None, {\"Colonist Rebel\", heading}}]")
![betweenness = BetweennessCentrality[personPersonGraph]; TopTen[betweenness, "Betweenness Centrality"]](https://content.wolfram.com/sites/39/2017/06/InOutImg164.png "betweenness = BetweennessCentrality[personPersonGraph]; TopTen[betweenness, \"Betweenness Centrality\"]")
Revere has almost double the score of the next highest colonist, Thomas Urann. What this indicates is Revere’s essential importance in the network as a broker of information. Since he is a member of five of the seven groups, this isn’t terribly surprising, but it would have otherwise been unnoticed without this type of inquiry.
ClosenessCentrality varies from betweenness in that we are concerned with path lengths to other actors. These agents who can reach a high number of other actors through short path lengths are able to disseminate information or even exert power more efficiently than agents on the periphery of the network. Let’s run our function on the network again and look at ClosenessCentrality to see if Revere still ranks highest.
![HighlightCentrality[personPersonGraph, ClosenessCentrality[personPersonGraph]]](https://content.wolfram.com/sites/39/2017/06/InOutImg174.png "HighlightCentrality[personPersonGraph, ClosenessCentrality[personPersonGraph]]")
Revere appears ranked the highest, but it is not nearly as dramatic as his betweenness score and, again, John Adams has a low score. Let’s grab the measurements for further analysis.
![closeness = ClosenessCentrality[personPersonGraph]; TopTen[closeness, "Closeness"]](https://content.wolfram.com/sites/39/2017/06/InOutImg184.png "closeness = ClosenessCentrality[personPersonGraph]; TopTen[closeness, \"Closeness\"]")
As our heat-map coloring of nodes indicates, other colonists are not far behind Revere, though he certainly is the highest ranked. While there are other important people in the network, Revere is clearly the most efficient broker of resources, power or information.
One final measure we can examine is EigenvectorCentrality, which uses a more advanced algorithm and takes into account the centrality of all nodes and an individual actor’s nearness and embeddedness among highly central agents.
![HighlightCentrality[personPersonGraph, EigenvectorCentrality[personPersonGraph]]](https://content.wolfram.com/sites/39/2017/06/InOutImg194.png "HighlightCentrality[personPersonGraph, EigenvectorCentrality[personPersonGraph]]")
There appears to be two top contenders for the highest eigenvector score. Let’s once again calculate the measurements in a table for examination.
![eigenvectorCentrality = EigenvectorCentrality[personPersonGraph]; TopTen[eigenvectorCentrality, "Eigenvector Centrality"]](https://content.wolfram.com/sites/39/2017/06/InOutImg204.png "eigenvectorCentrality = EigenvectorCentrality[personPersonGraph]; TopTen[eigenvectorCentrality, \"Eigenvector Centrality\"]")
Nathaniel Barber and Revere have nearly identical scores; however, Revere still tops the list. Let’s now take the top five closeness scores and create a network without them in it to see how the cohesiveness of the network might change.
![sHoleData = Select[PaulRevereData, ! MemberQ[{"Paul Revere", "Thomas Chase", "Henry Bass", "Nathaniel Barber", "Thomas Urann"}, #Name] &];](https://content.wolfram.com/sites/39/2017/06/InOutImg217.png "sHoleData = Select[PaulRevereData, ! MemberQ[{\"Paul Revere\", \"Thomas Chase\", \"Henry Bass\", \"Nathaniel Barber\", \"Thomas Urann\"}, #Name] &];")
![]()
![shbipartiteAdjacencyMatrix = Boole@Normal[sHoleData[Values, Rest]]; shedges = ReplacePart[ shbipartiteAdjacencyMatrix.Transpose[ shbipartiteAdjacencyMatrix], {i_, i_} -> 0]; shpersonPersonGraph = AdjacencyGraph[shcolonistsNames, shedges, EdgeStyle -> {Opacity[.1]}, GraphLayout -> "RadialDrawing", VertexLabels -> Placed["Name", Tooltip], PlotLabel -> "Without Key Colonists"];](https://content.wolfram.com/sites/39/2017/06/InOutImg234.png "shbipartiteAdjacencyMatrix = Boole@Normal[sHoleData[Values, Rest]]; shedges = ReplacePart[ shbipartiteAdjacencyMatrix.Transpose[ shbipartiteAdjacencyMatrix], {i_, i_} -> 0]; shpersonPersonGraph = AdjacencyGraph[shcolonistsNames, shedges, EdgeStyle -> {Opacity[.1]}, GraphLayout -> \"RadialDrawing\", VertexLabels -> Placed[\"Name\", Tooltip], PlotLabel -> \"Without Key Colonists\"];")
![GraphicsRow[{shpersonPersonGraph, personPersonGraph}, ImageSize -> Large]](https://content.wolfram.com/sites/39/2017/06/InOutImg244.png "GraphicsRow[{shpersonPersonGraph, personPersonGraph}, ImageSize -> Large]")
We see quite a dramatic change in the graph on the left with our key players removed, indicating those with the top five closeness scores are fairly essential in joining these seven political organizations together. Joseph Warren appears to be one of only a few people who can act as a bridge between disparate clusters of connections. Essentially, it would be difficult to have information spread freely through the network on the left as opposed the network on the right that includes Paul Revere.
Conclusion
As we have seen, we can use network science in history to uncover or expose misguided preconceptions about a figure’s importance in historical events, based on group membership metadata. Prior to Fischer’s analysis, many thought Revere was just a courier, and not a major figure. However, what I have been able to show is Revere’s importance in bridging disparate political groups. This further reveals that the Revolutionary movement was pluralistic in its aims. The network was ultimately tied together by disdain for the tyranny of King George III, unjust British military actions and policies that led to bloody revolt, not necessarily a top-down directive from political elites.
Beyond history, network science and natural language processing have many applications, such as uncovering otherwise hidden brokers of information, resources and power, i.e. social capital. One can easily imagine how this might be useful for computational marketing or public relations.
How will you use network science to uncover otherwise-hidden insights to revolutionize and disrupt your work or interests?
Special thanks to Wolfram|Alpha data scientist Aaron Enright for helping with this blog post and to Charlie Brummitt for providing the beginnings of this analysis.
Download this post as a Computable Document Format (CDF) file. New to CDF? Get your copy for free with this one-time download.

This was absolutely fascinating. Thank you for sharing!
Fascinating article. Nice use of wolfram tools and explanations. Thank you.