Hunting for Turing Machines at the Wolfram Science Summer School
This year is the 100th birthday of Alan Turing, so at the 2012 Wolfram Science Summer School we decided to turn a group of 40 unassuming nerds into ferocious hunters. No, we didn’t teach our geeks to take down big game. These are laptop warriors. And their prey? Turing machines!
In this blog post, I’m going to teach you to be a fellow hunter-gatherer in the computational universe. Your mission, should you choose to accept it, is to FIND YOUR FAVORITE TURING MACHINE.
First, I’ll show you how a Turing machine works, using pretty pictures that even my grandmother could understand. Then I’ll show you some of the awesome Turing machines that our summer school students found using Mathematica. And I’ll describe how I did an über-search through 373 million Turing machines using my Linux server back home, and had it send me email whenever it found an interesting one, for two weeks straight. I’ll keep the code to a minimum here, but you can find it all in the attached Mathematica notebook.
Excited? Primed for the hunt? Let me break it down for you.
The rules of Turing machines are actually super simple. There’s a row of cells called the tape:
![]()
Then there’s a head that sits on the tape like so:
![]()
The head can point in different directions to show what state it’s in. Let’s say there are just three possible states, so the head can point in three different directions:
 2
2
In addition, each cell on the tape has a color. In the simplest case there are just two possible colors, black or white (binary):
![]()
So for each of the three head states, there are two possible cell colors, giving six different situations:

The rule table tells the Turing machine what to do in each situation:

You can see how it works: the cell under the head changes color, then the head moves left or right and updates its state.
So let’s say the head is in state 1 on a blank tape:
![]()
We look up the case in the rule table where the head is on a white cell in state 1:

The rule says the cell under the head changes to black; the head moves left, and goes into state 3:

Notice we are showing the updated tape right below the old one. That way we can see where the head was on the previous step and where it is currently.
Now the head is in state 3 on a white cell, so we look that case up:

The rule says the cell changes to black; the head moves right, and goes into state 2:

Now the head is in state 2 and this time it’s on a black cell:

The rule says the cell stays black; the head moves right, and goes into state 3:

Getting the hang of it? Pretty simple, right? Here’s what the Turing machine evolution looks like after 20 steps:

You can use this handy little CDF to follow along. It shows the evolution step by step, indicating which case in the rule table is used each time:

Now let’s use the built-in TuringMachine function to run this Turing machine rule. Here are the rules, in the form {state, cell color} -> {new state, new color, head movement}:

We just plug in the rules with the initial condition—a blank tape with the head in state 1 (note that states 1, 2, and 3 are denoted 0, 1, and 2)—and the number of time steps to run for:
![]()
Here’s what the tape looks like after 200 steps:
![]()

See the pattern? The head zigzags back and forth, and as soon as it reaches further left than ever before, it zooms to the right and repeats the process.
Another way to view the evolution is to look at the position of the head over time:
![]()

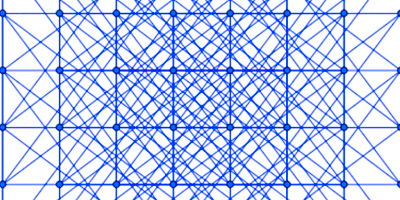
The pattern is clearer if we run it for more steps:
![]()

The overall growth goes in sections of zigzags, where each section takes longer than the last. When the head reaches the left side, it zooms to the right and starts a new section.
Now let’s try compressing it to show just the steps where the head goes further to the right than ever before:
![rightcompress[evol_List] := Module[{maxright = evol[[1, 1, 2]]}, Reap[If[#[[1, 2]] > maxright, maxright = #[[1, 2]]; Sow[#]] & /@ evol][[2, 1]]]](https://content.wolfram.com/sites/39/2012/12/Turing-In33.png "rightcompress[evol_List] := Module[{maxright = evol[[1, 1, 2]]}, Reap[If[#[[1, 2]] > maxright, maxright = #[[1, 2]]; Sow[#]] & /@ evol][[2, 1]]]")


The compressed tape is easier to visualize. The head in the compressed evolution is just steadily moving to the right:


Let’s try changing the rule slightly to see if we can make it do something more interesting. Here’s the rule table again:

Now we are going to change the rule so when the head is in state 1 on a white cell, it goes to the right rather than the left:


Here’s what this new rule does:

Boring! The head always moves right and turns the cell black, so it just creates a growing black triangle (at least for this initial condition).
So now you might be wondering, what happens when the head goes all the way to the right edge of the tape? Does it stop or keep going? Well, it kind of depends on who you ask. At the summer school, we use the convention that the head just wraps around and keeps going from the left:

We call this a “periodic boundary”. The other convention you could choose is called the “halting” condition, where the head just stops at the right edge of the tape and the game is over.
Side note: this seemingly trivial detail has actually gotten a LOT of attention. It turns out that there are Turing machines (like the one Turing constructed in his famous 1936 paper) where it is impossible to predict (“undecidable”) whether or not the head will reach the right edge and halt. This is called the “halting problem”. And there are even so-called “busy beaver” competitions where people try to find Turing machines that will run the longest before eventually halting.
So is it even possible to get something more interesting by changing one of the cases in the rule table? How about a pattern that grows more slowly? Or one that never repeats? Well, it’s kind of hard to tell just by thinking about it, isn’t it? I mean, you have to basically run the rule in your head to figure it out. This happens so often with Turing machines that they gave it a name: computational irreducibility.
But that doesn’t mean we’re stuck, because we have Mathematica! Let’s just enumerate all the possible point changes to the rule and show them all in a table like so (see the attached notebook for the code):

Each one of these is a different Turing machine with a rule table that differs by just a single change from the original rule (there are 24 similar rules in all, in a 6×4 grid). While there is quite a variety, they are all pretty predictable. Nothing earth-shattering.
But these 24 rules are just a small sample of all the possible Turing machine rules with three states and two colors. Just think about it: for each of the six cases in the rule table, there is a choice of what the new color should be, which state the head will be in, and which direction it will go. If you do the math, it turns out that there are over 2 million of them:
![]()
![]()
![]()
And if you think that’s bad, the faculty at the Wolfram Science Summer School decided to be really diabolical and make the students choose their favorite 4-state, 4-color Turing machine. And just how many rules is that to choose from?:
![]()
![]()
Mwahahhaaha!!!!
Needless to say, an exhaustive search was pretty much out of the question. :)
So the students had to figure out some tricks for searching for Turing machines with the kinds of features they were interested in. And with so many rules to sort through, it was definitely a needle-in-a-haystack situation.
But the students were up to the challenge, and they got really creative. They ran searches using Mathematica looking for things like:
the slowest possible growth of the tape:

patterns on the tape with high entropy:

patterns too complex to be digitally compressed:


and rules that sound interesting when their features are sonified (check out WolframTones):


These are just a few of the 39 student submissions.
And here are some of the compressed outputs from the student submissions:

I decided I wanted to do a search too. I wrote a Mathematica script to do an automated search for Turing machines that met certain criteria:

The script chooses random rule numbers to run and test, and then writes the rule number and some statistics to a file called tm-4-4-search.txt for each Turing machine rule that passes through the various filters.
The filters are run in stages, with faster filters running before the slower ones, to minimize the time spent running the slower filters on rules that don’t have a chance of making it through anyway. The final filter measures the complexity of the compressed tape using this block-entropy measure (which was thought up by one our fine high school students this year):
![minentropy[tapeevol_List] := Plus @@ Total[ Min@Table[ N@Entropy@Partition[#, i, 1]/N@Log@Length[#], {i, 1, 4}] & /@ tapeevol]/N@Length@tapeevol](https://content.wolfram.com/sites/39/2012/12/Turing-In105.png "minentropy[tapeevol_List] := Plus @@ Total[ Min@Table[ N@Entropy@Partition[#, i, 1]/N@Log@Length[#], {i, 1, 4}] & /@ tapeevol]/N@Length@tapeevol")
A Turing machine with very random-looking compressed output would have an entropy closer to 1, and one that has a lot of structure or organization to it would have an entropy closer to 0.
If a rule makes it through this final entropy filter, the script outputs a little summary image of the rule as a .png file. I made sure the summary image was small enough for me to easily glance at in Mail.app on my iPhone 4. Here’s an example:

The compressed tape is shown at the top, followed by a few statistics (more on those in a second), and then a ListPlot of the head movement for the first 5,000 time steps.
I ran the Mathematica script on my Linux server back at the Wolfram headquarters in Champaign, Illinois. To alert me when interesting rules were found, I wrote a simple daemon shell script to poll the log file for new results and email me whenever an interesting new rule was found:

The search ran for 16 days, searching a total of 373 million Turing machines, at a rate of about 270 Turing machines per second. It ended up finding about 13,000 interesting rules. On average, the search script emailed me an interesting rule about once every two minutes or so.
That was way too many emails for me to look through exhaustively. So after the summer school was over, I took all the winning rule numbers and jammed their compressed outputs into little 5×10 grids like so:

This way I could look at grids of 50 rules at a time, and the total result set of 13,188 rules only occupied 264 grids. I could get a pretty good feeling for the rules in one grid in about 10 seconds, so the entire process of looking through all 13,000 rules only took about 45 minutes.
After all that, I chose my favorite 4-state 4-color Turing machine, rule number 348,371,888,147,308,385,687,045. Here’s what the compressed outputs look like, compressing by keeping just the steps where the head had moved further left than ever before:
![]()
![]()

And here’s what the tape output looks like when compressing by keeping just the steps where the head has moved further right than ever before:
![]()

This rule popped up in my search because it had irregular head movement:
![]()

I quantified this by measuring the number of distinct distances the head traveled continuously in one direction before turning around and going the other direction (which I call a “run length”):
![(*Number of distinct run lengths:*) firstmoment[headpos_] := Length@Tally[Length /@ Split@Differences@headpos]](https://content.wolfram.com/sites/39/2012/12/Turing-In132.png "(*Number of distinct run lengths:*) firstmoment[headpos_] := Length@Tally[Length /@ Split@Differences@headpos]")
![]()
![]()
But in this case there was also a rather large number of run length frequencies, meaning the number of run lengths that appeared once, twice, three times, etc:
![(*Number of distinct run length frequencies:*) secondmoment[headpos_] := Length@Tally[ Length /@ Gather@Tally[Sort[Length /@ Split@Differences@headpos]][[ All, -1]]]](https://content.wolfram.com/sites/39/2012/12/Turing-In134.png "(*Number of distinct run length frequencies:*) secondmoment[headpos_] := Length@Tally[ Length /@ Gather@Tally[Sort[Length /@ Split@Differences@headpos]][[ All, -1]]]")
![]()
![]()
A strictly nested pattern will often have a lot of different run lengths but a small number of run length frequencies. For example, the head might just be bouncing from left to right on the tape, going a little farther each time. In that case, there would be a slightly larger run length every time it changed direction. But there would only be one run length frequency, equal to 1, because every run length would occur exactly once.
This rule, however, has four different run length frequencies, which means the head probably wasn’t just moving in a steadily growing pattern, but was zigzagging around in an irregular way.
But despite having fairly complex head movement, there’s obviously quite a lot of structure to the compressed tape output—it certainly doesn’t look random.
This is the distribution of entropies in the 13,000 Turing machines returned by my über-search:

My favorite rule has a relatively low entropy of 0.12 (on my normalized scale), well below the average (which is about 0.24), indicating that it is highly organized:
![]()
![]()
And you can see that structure clearly in the compressed output, with the three distinct domains of behavior you see scanning the tape from left to right:

It would be interesting to study these three domains of behavior in detail, and find out what this Turing machine is ultimately computing. Could we program it to behave like a fluctuating molecule, or a flock of birds, or a human brain? Stephen Wolfram’s Principle of Computational Equivalence says that a Turing machine with such complex-looking output is probably capable of universal computation, meaning we could use it to compute anything we want to with a suitable encoding of the initial conditions.
I’ve shown you how awesome Turing machines are, and how much fun it is to search for them in Mathematica. I think Turing would have been proud to see all the cool Turing machines unearthed by our students this year. If you want to take your hunting skills to the next level, you can apply to Wolfram Science Summer School to try your hand at exploring your favorite part of the computational universe. Here’s the hunting party from last summer:

See you at the Wolfram Science Summer School in 2013!
(No Turing machines were harmed in the making of this blog post.)
Download this ZIP file that includes the blog post as a CDF and all code used in the post.

That’s very cool; I’ll have to play around with this myself sometime. I’d love to see an extension into two dimensions (“turmites”) – I know the maths is pretty much the same but it might be more obvious to the human eye that something “interesting” is happening when the turing machine output is an image rather than a line.
Hi Ruben
The colors in each row not affected by the currently applicable rule are inherited, i.e., copied down, from the previous row (set of states). There is only one tape; the display is meant to show how the tape evolves, step by step on each successive row. Cheers.