Planning a Trip? Ask Mathematica for the Itinerary.
With all the new aspects of Mathematica in Versions 6 and 7, I’ve enjoyed visiting universities to talk about how to use Mathematica in even more courses and research projects. Universities enjoy this, too!
I am not, however, very good at thinking about the locations of universities or schools in terms of geography. Planning a trip was a seemingly endless task of cross-referencing maps and lists and notes and more lists—I’m sure you see a pattern forming here.
The solution, as is often the case with me, was to use Mathematica. After finding a list of 7,000+ universities and colleges in the United States, I wrote a Mathematica program to create a list of all such schools near a particular city, complete with rough mileage and a map to use for my work.
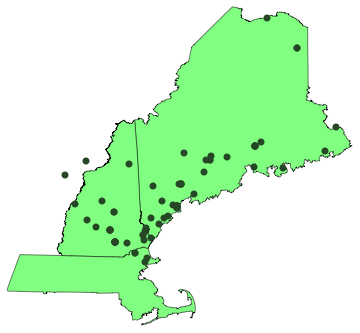
I was planning a visit to universities in Maine, so I naturally asked myself, “How many universities and colleges can I visit in a week?” My Mathematica program easily gave me the answer: here are the closest 75 schools to Bangor, Maine (in Mathematica itself you can mouse over the points to see the names of the particular schools):

Here is a list of the first few with rough mileage:

How does the program really work? With a name like Mathematica, some readers might think that Mathematica does the mathematical sorts of things and that I might be using some other software for drawing maps or sorting/importing data. But it’s all Mathematica!
It’s very simple to use Mathematica‘s curated data to get the latitude and longitude for a particular city. For instance, I might want to see where Orono is in relation to Bangor.

The Version 7 function GeoDistance gives a distance between two cities in miles:

This looked good. So I defined a function and used Mathematica‘s built-in CityData information to calculate mileage between two cities:

and made a version that eliminated strange source data:

I then checked to make sure that function worked as intended. In my mind, of course it did, but I always like to check.


Looked good—it worked for real cities and handled unknown cities just as I intended. I could then use Mathematica‘s programming language to fly through this process for my list of universities.

Going back to my trip planning, I asked for the closest 20 universities to Bangor, Maine.

That list of numbers interested me; I had thought that the universities would be more clustered in the state of Maine. I graphed that data in bar-chart form to visualize it a bit better.

Outside Bangor, there is little clustering in terms of distances between universities. This is something that I find invaluable about using Mathematica: I can explore things that I didn’t even know that I wanted to explore! I thought it would be interesting to compare Bangor to Bloomington, Indiana and Amherst, Massachusetts to see which area has the most clusters of universities.

It seems that Bloomington, Indiana has the most clustering in terms of the geography of universities among these three cities.
But back to the problem at hand: that all gave me a numeric value in miles corresponding to the closest universities. I added labels to see which universities those are, and a check that excludes any bad data and error messages.


That looked great, and pretty close to the first list above. The only surprise was the computation time; I was downloading and checking a lot of data each time I used the application. And this certainly wasn’t the most elegant way to approach the problem—the program always checked mileage for universities in California for a starting city of Bangor, Maine! How long did this really take?

Mathematica had already reduced my route-planning time from hours to under a minute… but when Version 7 was released with high-level parallel functions, I immediately put them to good use with this program. I changed the Map[ ] command to ParallelMap[ ]:

What did that specifically do in terms of calculation time? The command to launch worker kernels is useful for a dual- or multi-core machine, and DistributeDefinitions let the worker kernels know about my custom functions.


A change to just one word cut the calculation time almost in half! I always love maximum results with minimum effort.
Somewhere along the line, other people in my department started to see these maps and wanted to use this application. They are all Mathematica users, but I thought it would be nice to document the application a bit with a custom interface. So here’s the final product:

My parting words of advice: take a minute to look through all the curated data in Mathematica and then think about what your next step might be to create a neat application. I’d bet you can come up with something much more interesting—this just barely scratches the surface!


